


5 Ways to Connect Employee Wellbeing Metrics to Company Performance and Marketplace Financial Metrics (EBITDA)
5 Ways to Connect Employee Wellbeing Metrics to Company Performance and Marketplace Financial Metrics (EBITDA)
This article is aimed at senior HR and benefits leaders responsible for ensuring employee wellbeing investments drive real business outcomes. Drawing on HealthNEXT’s population health and analytics expertise, it outlines five practical ways to design health and wellbeing metrics that stand up to CFO scrutiny, connect directly to EBITDA and company performance, and guide smarter strategic decisions.
When wellbeing metrics meet marketplace financial metrics – EBITDA
When your CEO asks, “Are our investments in employee health and wellbeing paying off?”, the quality of your metrics will determine whether you have a quantitative confident answer or a qualitative defensive explanation.
Best-in-class organizations have dashboards, scorecards, and vendor reports; but most fall short of this aim of having a coherent measurement strategy that helps HR leaders see where progress is happening, where barriers remain, and what to do next.
As workforce health, talent attraction and retention, and financial performance become more tightly linked, HR can no longer rely on simply reporting participation rates and program satisfaction alone. Since health‑related productivity losses have been shown to be 2-3 times direct medical and pharmacy costs, the real impact of workforce health is felt in overall business performance—not just in the health benefits costs.
What makes a “good” metric in employee health and wellbeing?
Not every metric belongs on an executive report. Some numbers look impressive but don’t support decision-making; others predict risk early and point leaders toward meaningful action.
For HR leaders, a “good” health and wellbeing metric has five core characteristics:
- It is quantitative versus qualitative
- It balances leading and lagging indicators
- It is causally linked (or strongly associated) with business outcomes
- It is comparable over time and against benchmarks
- It is easy to calculate and accessible for leaders to review and act on regularly
The goal is not to collect more data, but to curate a small set of metrics that help you answer three questions: Where are the prevalent health risks and conditions? Are we improving? What should we do next?
Together, these five characteristics offer a practical way to audit and reshape your health and wellbeing reporting so they pinpoint risks, inform action, and demonstrate impact.
1. Make your wellbeing metrics quantitative, not just qualitative
Employee stories and sentiment are essential, but HR leaders need numbers that are comparable to those generated by finance and operations.
Qualitative inputs—focus groups, open‑ended survey comments, listening sessions—help you understand “why” employees feel the way they do. Quantitative metrics—like prevalence of key health risks, lost workdays, voluntary turnover, safety incidents, and perhaps most importantly productivity loss—help you quantify the size of the problem and track improvement over time.
For example:
- Instead of just tracking program participation in health coaching or EAP also measure the percentage of employees with uncontrolled hypertension, depression, or musculoskeletal pain, and how those conditions relate to absence and performance
- Instead of only tracking “employee satisfaction with wellness programs,” also track changes in preventive care adherence, chronic care compliance, and workers’ compensation claims
Qualitative insights should inform which quantitative metrics you choose and how you interpret them but the metrics themselves must be measurable, repeatable, and precise enough to influence resource allocation.
2. Balance leading and lagging indicators
Many HR reports lean heavily on lagging indicators alone such as — hospital admission rates, ER usage, healthcare cost trend, turnover rates, disability and workers’ compensation claims. These are important, but they only tell you what has already happened.
To manage workforce health proactively, you need a balanced set:
Lagging indicators – to convey what already happened:
- Healthcare cost trend per employee
- Lost workdays due to illness or injury
- Voluntary turnover
- Short‑ and long‑term disability incidence and duration
- Workers’ compensation claim frequency and severity
Leading indicators – to signal future risk before it affects outcomes:
- Prevalence of key health risks and chronic conditions (e.g., mental health, cardiometabolic risk, musculoskeletal issues)
- Participation and completion rates for evidence‑based programs that address these prevalent risks and conditions (e.g., coaching, disease management, complex care management CBT, physical therapy
- Primary care attribution and recommended preventive care adherence
- Psychological safety and workload stress indicators that predict burnout and attrition
Leading indicators give you early warning that productivity, safety, or retention may be at risk, so HR and business leaders can intervene before those risks appear as higher costs, safety incidents, or turnover. These predictive measures should be prominent in the executive reporting view discussed later in this article.
3. Tie wellbeing metrics directly to business outcomes
The most powerful wellbeing metrics are those that tie directly to outcomes your C‑suite already cares about: EBITDA, productivity, safety, quality, and customer experience.
Consider focusing on metrics that link cause and effect, such as:
- Relationship between illness burden reductions and improvements in sales or safety
- Associations between workforce stress and absenteeism, overtime, and turnover
- Changes in enterprise health assessment scores such as HealthNEXT’s Culture of Health and Wellbeing best practice maturity assessment scores and reductions in medical trend or productivity gains over time
When you can show that improving maturity scores are associated with lower medical trends and stronger business performance, wellbeing stops being a cost-center conversation and becomes a respected contributor to company performance.
4. Benchmark and trend wellbeing metrics over time
A metric has limited value if you can’t see how it’s changing or how it compares with peers and benchmarks. HR leaders need health and wellbeing metrics that are:
- Trended over time
- Filtered and viewable by location, business unit, job family, or demographic group where appropriate
- Compared to internal targets, external norms, and best‑in‑class performers
For example, benchmarking prevalence of chronic conditions, mental health risk, and participation in targeted programs against other employers health and wellbeing trend reports can highlight where your organization is ahead, where you are lagging, and where investments are likely to have the greatest impact.
5. Integrate wellbeing data into accessible, actionable cockpits
Even the best metrics fail if they live in siloed spreadsheets or vendor portals. For health and wellbeing data to influence decisions, leaders need accessible, integrated views that they can interpret in minutes and act upon.
A corporate cockpit is an executive-level reporting tool that brings a small, carefully selected set of workforce-health, operational, and financial metrics into one integrated view. It is not simply a dashboard of everything available; it is a decision-making tool designed to help leaders identify risk, monitor progress, and prioritize action.
A balanced cockpit or dashboard should adhere to the healthcare quality “Triple Aim” of improving health.
Characteristics of an accessible, organized collection of “Triple Aim” metrics include:
- Effectiveness – metrics that demonstrate that the workforce is getting healthier over time – such as reductions in health risks and the prevalence in chronic conditions
- Efficiency – metrics the document reductions in medical trend versus norms
- Experience – satisfaction surveys that show how much the workforce appreciates the benefits and programs the enterprise delivers to support their health, safety and wellbeing
When metrics are easy to review in monthly or quarterly business reviews, leaders across the company (HR, safety, operations, and finance) can align on priorities and hold each other accountable for action. When credible metrics show significant impacts securing resources for additional benefits and programs is considerably easier.
Connecting workforce health to business performance
In many organizations, HR leaders spend most of their time explaining rising healthcare costs and reacting to workforce challenges.
By choosing better metrics and using them to guide a sequenced, data‑driven roadmap, HR leaders can shift the conversation from “How do we control costs?” to “How do we protect and enhance the performance of our workforce?”
Ultimately, the differentiator is not how many wellbeing programs you offer, but how effectively you measure what matters, act on those insights in the right order, and sustain accountability over time. That is what will position you as the executive who connects workforce health to business performance.


How To Measure the Business Impact of Workforce Health and Wellbeing Well Beyond Participation
How To Measure the Business Impact of Workforce Health and Wellbeing Well Beyond Participation
This article explains how employers can use layered measurement tools—scorecards, dashboards, and cockpits—to track and improve workforce health, performance, and business outcomes. Written by the team at HealthNEXT, it is designed for C‑suite executives, CHROs, and HR leaders who are accountable for workforce strategy, culture, and financial performance. It focuses on how to align site‑level scorecards, program-level dashboards, and an enterprise cockpit to quantify illness burden and productivity loss, while connecting clinical, cost, and employee experience outcomes to better inform decisions and to generate sustained results.
Building a layered measurement system for workforce health and wellbeing
Health and wellbeing touch every corner of the organization—from frontline worksites and plants to business divisions and the ultimately the C‑suite—but the data each level needs to drive results is different. Participation counts are a useful starting point, yet on their own they don’t tell local managers, business unit leaders, or senior executives whether those activities are improving health, reducing risk, or supporting performance, so these investments still often get managed reactively instead of strategically.
To move beyond participation and truly measure business impact, employers need a layered measurement system that tailors insights to each level of the organization. Site‑level scorecards help managers track participation alongside health risks and healthcare outcomes they can influence directly. These scorecards can be aggregated into business dashboards to provide insights for division leaders. And division dashboards can be aggregated into an enterprise cockpit for a concise, C‑suite‑ready picture of workforce health, performance, and culture.
This “top‑down and bottom‑up” structure ensures that data is both relevant and connected. Scorecards drive specific locations. Dashboards assist business units to act; and the enterprise cockpit gives senior leaders a coherent view of how health and wellbeing are contributing to overall business performance.
Regardless of whether we are building scorecards, dashboards or cockpits the measurement approach is the same. They need to be:
- Simple and easy to understand, balancing leading indicators (like screening rates and engagement) with lagging ones (such as absence, workers’ compensation claims, or chronic condition prevalence).
- Comparable over time and across sites, so leaders can “rack and stack” locations, identify best performers, and support sites that are falling behind.
- Directly tied to specific actions, such as strengthening mental health programs, improving medical home attribution, or closing preventive care gaps, so managers and leaders know what to promote to the segment of the workforce under their responsibility.
Well-constructed health and wellbeing scorecards, dashboards and cockpits typically:
- Organize metrics around the Triple Aim, showing whether your workforce and covered lives are becoming healthier (effectiveness), whether investments are moderating cost trends and performance loss (efficiency), and whether employees and families feel cared for and satisfied with their benefits and programs (experience).
- Aggregate key measures such as participation, health risks, chronic condition prevalence, medical home attachment, safety outcomes, and engagement, alongside business KPIs like medical and pharmacy cost trend, absence, disability, and workers’ compensation.
- Highlight patterns and gaps, making it clear where the program is approaching benchmark performance and where focused support or additional investment is needed.
Scorecards: Giving local leaders the right levers
Scorecards sit at the lowest level of the measurement hierarchy and are designed for individual locations, small business units, or worksites. They translate corporate strategy into a concise set of metrics local leaders can influence directly, such as participation in wellbeing programs, adherence to safety protocols, completion of health assessments or biometrics, and local illness or injury trends.
Scorecards can show managers the specific profile of their own site or unit, which may look very different from others across the organization. A location with overnight shift workers, a more isolated workforce, a higher-risk operating environment, or different barriers to care may need a very different response than a corporate office or another business division.
In practice, many employers find it hard to obtain consistent, worksite‑level data unless they conduct regular site scans and assessments or partner with a data warehouse/analytics vendor that can pull together information from health plans, vendors, HR systems, and safety programs and generate a composite view at the site level.
This bottom-up view is critical because cultures of health and wellbeing are “lived locally”, not just declared in corporate policy. Employers that combine site-specific assessments with integrated analytics are better positioned to build scorecards that reflect local reality and guide action where it can be most impactful.
Dashboards: Seeing program performance through the Triple Aim
There are two common kinds of dashboards. One type rolls up scorecards to provide a business or division-level view, aggregating site metrics so leaders can see how their part of the organization is performing. The second type evaluates a specific program or portfolio of programs implemented across the enterprise, showing how those health and wellbeing initiatives are performing against the Triple Aim.
A best-practice example of this second type is a behavioral health dashboard that pulls together data from multiple sources: EAP contacts and outcomes, utilization of psychological and psychiatric services, health risk appraisal results, biometric indicators, and use of healthcare services from inpatient and outpatient care to emergency room visits. By integrating these data streams, the dashboard can show whether behavioral health efforts are improving health and functioning (effectiveness), reducing avoidable utilization and productivity loss (efficiency), and enhancing employee perceptions of support and satisfaction with available resources (experience).
Cockpits: A one‑page view for the C‑suite
At the top of the hierarchy is the corporate cockpit: an integrated collection of a few, carefully chosen metrics that let executives manage workforce health as a strategic asset. A mature cockpit goes beyond traditional claims reporting by bringing together efficiency, effectiveness, and experience indicators—aligned with the Triple Aim—in an executive‑ready enterprise presentation.
Effective C‑suite‑ready cockpit metrics and visuals share several traits:
- Quantitative, with clear numeric values compared against goals and benchmarks.
- Actionable, clearly linked to specific levers in benefits, workplace design, and management practices.
- Focused on leading indicators wherever possible, such as the prevalence of key risks and conditions, preventive care adherence, and primary care attachment, rather than relying solely on last year’s spend.
- Causally connected, showing how risk factors lead to illness burden, claims, productivity loss, and turnover so leaders can see the full business impact.
Example Cockpit
In the example cockpit image below, the red, yellow and green colors indicate how the metrics are doing relative to goal: red is below goal, yellow is around goal, and green is above goal.
The arrows indicate which direction the trend is heading.
For example, employee turnover is above goal but currently trending downward, signaling to the C-suite the potential for next steps to avoid a downward trend.

Why HR and the C‑suite can’t afford to fly blind
For HR teams and senior leaders, the stakes are high. Healthcare spending captures only part of the impact; performance and productivity losses can be two to three times the cost of care, yet they are often invisible without the right measurement system.
When data is fragmented, it is nearly impossible to see where value is being lost or where health and wellbeing investments are quietly delivering outsized returns. A layered system of scorecards, dashboards, and cockpits turns workforce health from a blurry cost center into a strategic asset that leaders can actually manage.
By implementing aligned scorecards, dashboards, and cockpits, employers can:
- Treat workforce health data as a strategic asset.
- Direct leadership attention and resources to the highest‑value opportunities along the population health continuum.
- Demonstrate, with evidence, how a strong culture of health and wellbeing contributes to lower medical cost trends, fewer injuries and absences, better retention, and stronger business performance.
Ultimately, what gets measured gets improved and when you measure health and wellbeing with the same rigor as any other core part of the business, you give your organization a durable competitive advantage.
Ready to see what a system of layered and connected scorecards, dashboards and cockpits could look like for your workforce? Contact HealthNEXT to explore how we can help you build a measurable, sustainable culture of health, safety and wellbeing.

Effectiveness, Efficiency, Experience: Using the Triple Aim to Translate Health Data into Results
Effectiveness, Efficiency, Experience: Using the Triple Aim to Translate Health Data into Results
This article explains how employers can use the Triple Aim framework to measure and improve workforce health, performance, and business outcomes. Written by the team at HealthNEXT it is designed for C‑suite executives, CHROs, and CFOs who are accountable for workforce strategy, culture, and financial performance. It focuses on how to apply the Triple Aim—effectiveness, efficiency, and experience—to employer health and wellbeing analytics, including workforce illness burden, productivity loss, and integrated dashboards that link clinical, cost, and employee experience outcomes.
What is the Triple Aim?
In healthcare, the Triple Aim concept popularized by Dr. Donald Berwick calls for better care, lower cost, and improved patient experience. HealthNEXT adapts this thinking for employers as three interconnected aims: effectiveness, efficiency, and experience.
Effectiveness: Are your workforce and covered lives actually becoming healthier and more well over time, with lower illness burden and better performance status?
Efficiency: Are your investments in health and wellbeing reducing performance loss, moderating cost trends, and improving productivity per dollar spent?
Experience: Do employees and families feel cared for, satisfied with their benefits, and loyal to your organization because of how you support their wellbeing?
Instead of looking at a single metric like medical cost trend, the Triple Aim pushes employers to balance all three dimensions so that progress in one area is not achieved at the expense of another.
Inside the Triple Aim: metrics that matter
Most employers now receive a flood of reports from health plans, PBMs, wellbeing vendors, EAPs, and safety partners, but those reports often sit in silos and do not clearly answer the question, “Are our people healthier, more productive, and more engaged—and is it worth what we’re spending?”
HealthNEXT’s Triple Aim model translates each aim into practical employer metrics that can be embedded in dashboards, scorecards, and executive cockpits. These metrics can be tracked at the enterprise, business unit, site, or vendor level to support continuous improvement.
Effectiveness: are people getting healthier?
Effectiveness is defined as evidence that your workforce and covered lives are becoming healthier and more well, with lower aggregate illness burden and better functional status.
Typical metrics include:
- Preventive service rates increasing (e.g., mammography, colon cancer screening, immunizations) versus evidence‑based targets or HEDIS norms.
- Closure of evidence‑based care gaps for chronic conditions such as diabetes, cardiovascular disease, musculoskeletal disorders, and behavioral health.
- Reductions in aggregate risk scores from health assessments and biometric screenings, showing fewer people in high‑risk categories.
- Decreases in the prevalence of key health risks (such as obesity, smoking, and physical inactivity) and in the prevalence of chronic conditions over time.
- Increased medication adherence and treatment compliance, especially for high‑impact conditions, often with 80–85% adherence as a stretch target.
For the C‑suite, a compelling effectiveness story might sound like: “Over three years, high‑risk prevalence dropped by 10 percentage points, chronic musculoskeletal and diabetes trends stabilized, and 80% of covered lives now have a primary care medical home.”
Efficiency: are you saving money and performance?
Efficiency captures evidence that your efforts are saving money, worktime, or advancing productivity and performance, not just moving costs from one bucket to another.
Representative metrics include:
- Per–employee-per-year (PEPY) or per-member-per-year (PMPY) total medical and pharmacy cost trends that are lower than external benchmarks (e.g., PwC, Mercer).
- Reduced hospital admissions and days per thousand, shorter average lengths of stay, and fewer avoidable emergency room visits.
- Greater use of lower‑cost sites of care such as urgent care and telemedicine, when appropriate.
- Decreases in lost workdays due to illness (absence) and lost workforce performance while at work (presenteeism).
- Lower workers’ compensation and disability claim costs over time.
From a CFO viewpoint, efficiency metrics allow leaders to quantify savings per million dollars of healthcare spend, show how many FTEs have effectively been “returned” through lower health‑related time loss, and demonstrate cost avoidance compared with industry trends.
Experience: do employees feel cared for?
Experience reflects evidence that your efforts are appreciated and are generating loyalty, trust, and discretionary effort among employees and covered family members.
Key metrics typically include:
- Improvements in self‑reported health status through validated survey questions or wellbeing indices.
- Rising satisfaction with benefits, health plans, and wellbeing programs, including Net Promoter Scores (NPS) for platforms and vendors.
- High and improving participation in wellbeing initiatives, health challenges, and incentive programs across sites and demographic groups.
- Declining voluntary turnover compared with industry norms.
For HR and talent leaders, these metrics help connect a culture of health and wellbeing to engagement, retention, and employer brand, especially in competitive labor markets.
The Triple Aim in a culture of health and wellbeing
HealthNEXT’s broader methodology emphasizes building a culture of health and wellbeing across ten pillars, ranging from leadership and strategic planning to environment, engagement, vendor integration, and data warehousing. The Triple Aim serves as the measurement backbone for that culture, ensuring that every pillar ultimately contributes to effectiveness, efficiency, and experience.
When leadership sees all three aims trending in the right direction—better health outcomes, moderated cost growth, and improved employee sentiment—health and wellbeing move from “nice‑to‑have programs” to a core business strategy. This, in turn, supports higher productivity, fewer avoidable disruptions, and a more resilient organization during periods of change.
Case Study Example: from participation to performance
For most organizations, the first step is not launching new programs—it is fixing the way results are measured. That starts with getting the right data in one place and agreeing on a balanced Triple Aim scorecard that everyone in the C‑suite can understand at a glance.
A professional services firm had historically only reported wellbeing participation—how many employees completed a challenge or logged into a platform. After aggregating its health, HR, and productivity data, the organization re‑framed its reporting around the Triple Aim.
Instead of a standalone participation slide, leadership now sees on one page that: preventive screening and chronic care compliance are improving (effectiveness), the enterprise medical trend has fallen below industry benchmarks and health‑related days lost per employee have declined (efficiency), and self‑reported health and benefits satisfaction scores are rising while voluntary turnover is edging down (experience).
This shift allowed the C‑suite to see health and wellbeing as a strategic asset, not just a set of activities, and to invest with greater confidence in the initiatives that clearly move the needle on all three aims.
When employers adopt the Triple Aim as their measurement North Star, they gain a clearer view of how health and wellbeing investments drive financial performance, workforce resilience, and competitive advantage. That clarity is what ultimately allows leaders to sustain and scale a true culture of health and wellbeing across the enterprise.

Calculating the True ROI of a Culture of Health and Wellbeing
Calculating the True ROI of a Culture of Health and Wellbeing
This article lays out a practical roadmap for quantifying the return on investment (ROI) of health and wellbeing programs across your enterprise. It is written by the team at HealthNEXT for C‑suite leaders, CHROs, and CFOs who are accountable for workforce strategy, culture, and financial performance, and who want to treat wellbeing as a performance-driving investment rather than a cost center. The focus is on how to calculate ROI in concrete financial terms, normalize the data so it stands up to scrutiny, and pinpoint the categories where meaningful savings and value are created.
Why wellbeing ROI matters
Demonstrating clear ROI elevates health and wellbeing from a discretionary benefit to a strategic lever for cost management, productivity, culture, and talent. A structured ROI approach directs resources toward high‑impact programs, avoids “random acts of wellness,” and strengthens confidence in funding decisions. When organizations connect wellbeing to healthcare cost trends, absenteeism, presenteeism, and talent outcomes, they enable year‑over‑year tracking and continuous improvement that keeps investments aligned with both workforce needs and business goals.
Defining ROI
At its simplest, ROI compares the financial value generated by wellbeing programs to the total cost of those programs, but it should never be treated as a single, standalone metric. Instead, leaders should view ROI as the sum of multiple savings streams, including healthcare costs, workplace injuries, absence, disability, productivity, employee morale, and talent outcomes, so the full impact of wellbeing investments is visible.
To make these numbers meaningful and credible, results need to be normalized by accounting for shifts in employee count, average compensation, illness burden, benefit design, data coding practices, and broader healthcare and general inflation. When these adjustments are applied consistently across time periods, organizations create a defensible baseline that improves comparability, strengthens the integrity of their analysis, and supports more confident investment and budgeting decisions.
7 Core Savings Categories in Building Cultures of Health and Wellbeing
| Savings Category | Calculation Method | How Value Shows Up |
| Reduced healthcare costs | Compare your organization’s medical and pharmacy cost trend to external benchmarks (for example, PwC or Mercer), adjusting for items including relative illness burden. | Lower medical/pharmacy spend trend, lower claim cost per employee vs industry and inflation
|
| Fewer workplace injuries | Compare total workers’ compensation claims in a baseline period versus a period after implementing health, safety, and wellbeing programs, adjusting for items including inflation, recording changes, and acute incidents. | Reduced frequency/severity of injuries and workers’ comp claims
|
| Lower absenteeism | Track health related hours lost per 1,000 employees across baseline and comparison periods, then convert the difference into salary costs. | Fewer health-related hours lost and lower replacement costs
|
| Improved morale & retention | Compare your voluntary turnover rate to industry norms, calculate the number of “jobs preserved,” and then apply your replacement cost factor (often 1 to 2 times salary). | Lower voluntary turnover, reduced hiring and training costs vs norms
|
| Increased productivity | Measure productivity using validated tools such as the Standard Presenteeism Scale, Work Limitations Questionnaire, Harvard’s Health and Work Performance Questionnaire, or HRA-based productivity questions. | Reduced presenteeism (on-the-job performance loss)
|
| Reduced disability claims | Compare disability claim costs per 1,000 employees in baseline and post program periods, adjusting for items including inflation, workforce size, and any plan design changes. | Lower disability cost per 1,000 employees
|
| Enhanced company image | Track average time-to-fill positions against industry norms before and after strengthening wellbeing and culture, and compute the cost of unfilled positions in average salaried hours | Faster time-to-fill and better talent attraction
|
Bringing it all together for executives
By treating health and wellbeing as a strategic asset and using consistent, transparent methods, leadership teams can make sharper investment decisions, unlock measurable value, and align workforce wellbeing with long‑term financial and organizational performance.
For a deeper dive into calculating ROI with examples, send us a message.

Building GLP‑1 Benefit Strategies That Go Beyond TrumpRx Headlines
Building GLP‑1 Benefit Strategies That Go Beyond TrumpRx Headlines
TrumpRx‑era pricing and a rapidly evolving GLP‑1 marketplace are reshaping employer benefit decisions and plan design. Written by Dr. Ray Fabius, president of HealthNEXT and supported by the decades of experience of the HealthNEXT NEXTperts group practice, this article focuses on practical ways HR, benefits, and finance leaders can build integrated GLP‑1 strategies that manage cost, support equitable access, and improve workforce health and productivity.
The Stakes for Employers
GLP-1s are driving a large share of pharmacy trend, and many finance and HR leaders are feeling the impact in real time. At the same time, federal efforts like TrumpRx are changing how employees think about “fair” pricing and access. Employees are seeing headlines about lower direct-to-consumer prices and wondering why their employer plan looks different. Without a coherent strategy, employers risk paying more than they need to, disappointing employees, and missing the opportunity to actually improve health and productivity.
Obesity is a major driver of cardiometabolic disease, musculoskeletal problems, sleep apnea, certain cancers, and mental health conditions, all of which show up in absenteeism, disability, and presenteeism. Nearly two-thirds of the American workforce is overweight or obese, and by 2030, as many as one in two American workers may have obesity. That makes obesity both a health risk and a business issue.
GLP-1 medications such as semaglutide and tirzepatide have demonstrated meaningful, sustained weight loss, lower progression to type 2 diabetes, and fewer cardiovascular events in at risk patients. But those gains come with a high price tag, and employers covering GLP-1s are seeing pharmacy spend increase by 10–20% or more. In many organizations, weight management drugs account for a substantial portion of recent drug spend growth.
The central question is no longer “Should we cover GLP-1s?” but “How do we cover them in a way that delivers measurable value for our workforce and our budget?”
Why Coverage Without Support Backfires
The clinical evidence and mounting employer experience show that GLP-1s are most effective when combined with structured lifestyle and behavioral support. When people stop these medications, most will regain a significant share of the weight they lost, especially if healthy eating and physical activity have not become durable habits. That rebound is not just a clinical setback; it represents a poor return on a very large investment.
Adherence is another challenge. Side effects such as nausea, vomiting, diarrhea, constipation, hypoglycemia, injection site reactions, and pancreatitis contribute to discontinuation. Up to half of patients stop GLP-1 therapy in the first year, which undermines outcomes and wastes pharmacy spend.
Programs that combine medication with nutrition counseling, physical activity support, coaching, and behavioral health resources achieve much better persistence and value. For example, step therapy policies typically require members to try lower‑cost, evidence‑based options, such as lifestyle interventions and generic weight‑loss medications before “stepping up” to higher‑cost GLP‑1s, ideally under physician supervision and, when possible, in consultation with obesity‑medicine specialists who can individualize care.
International models reinforce this integrated approach. In countries like France, Germany, and Denmark, GLP-1s are typically prescribed with required nutritional counseling and specialist oversight, not as a standalone “quick fix.” The goal is to ensure that expensive therapies sit inside a care model designed for long term success.
TrumpRx and the New Pricing Reality
A new wave of formulations is further reshaping expectations. Both major manufacturers of the leading injectable GLP-1 medications now have FDA‑approved oral pill versions for weight management, and early pricing signals suggest these tablets are often 50% less expensive or more than the original injectable products depending on dose, channel, and plan design. As additional oral GLP‑1s and next‑generation agents enter the market, overall GLP‑1 treatment costs are expected to moderate over time as competition, new delivery forms, and alternative therapies expand employer and patient options.
Recent federal initiatives have added a new layer of complexity. Through TrumpRx and related agreements, manufacturers have lowered the direct-to-consumer price of several leading GLP-1s for eligible patients, while Medicare has agreed to expand coverage for certain indications. For some drugs, list prices that once exceeded 1,000 dollars a month are now being advertised starting around the mid-hundreds when purchased via TrumpRx.
From an employer’s perspective, this creates both opportunity and risk:
- Employees who see “headline prices” may assume those prices should automatically apply to the employer plan, even though plan costs are shaped by PBM contracts, rebates, and formulary design.
- Some employers are considering limited financial support (for example via a health reimbursement arrangement) for employees who purchase GLP-1s through TrumpRx or similar platforms when those medications are not covered under the plan.
- At the same time, employees who obtain GLP-1s through direct-to-consumer channels are less likely to receive the wraparound support, coaching, and care coordination that drive long-term success on and after these medications, which means employers could see more obesity related health care claims if the individuals on GLP-1s aren’t having sustained success.
This environment makes it even more important to have a thoughtful, transparent strategy that aligns coverage, affordability, and outcomes, and that deliberately connects GLP-1 access to the lifestyle, behavioral health, and care management resources employees need to succeed over the long term.
What Lilly Employer Connect Means for Plan Design
Adding to this complexity, Eli Lilly has launched its Lilly Employer Connect platform, which lets employers contract directly with a network of more than fifteen independent program administrators and a dedicated pharmacy network to expand access to its obesity medicines at lower, more predictable out‑of‑pocket costs for employees. These administrators range from low‑cost benefits administration partners to more holistic obesity‑care solutions that bundle clinical evaluation, virtual care, and behavior‑change support, giving employers new alternatives beyond traditional PBM arrangements.
For employers, Lilly Employer Connect effectively creates a parallel channel alongside TrumpRx and existing PBM contracts, one that is said to improve price transparency and cost predictability, but that still requires careful integration with plan design, step‑therapy policies, and equity goals to avoid fragmented care or uneven access.
A Blueprint for Value-driven GLP-1 Coverage
For employers, simply “checking the box” on GLP-1 coverage is not enough to manage cost, equity, or outcomes. A value driven approach builds GLP-1s into a broader, evidence-based obesity and cardiometabolic strategy.
HealthNEXT’s global group practice of clinical and executive “NEXTperts” recommends that employers consider the following design principles:
- Require participation in comprehensive lifestyle programs: This sets the expectation that medication is one component of a broader behavior change journey, not a standalone solution.
- Embed specialist expertise and centers of excellence: This improves clinical decision making, supports step therapy, and can reduce inappropriate prescribing.
- Integrate behavioral health, coaching, and care management: These services improve adherence and help employees sustain healthy habits even if medication is discontinued.
- Use clear, clinically grounded eligibility criteria: Prioritize GLP-1 coverage for employees with type 2 diabetes and those who meet FDA approved criteria for obesity treatment—for example, BMI greater than 30, or BMI greater than 27 with comorbidities such as hypertension, dyslipidemia, or established cardiovascular disease. As prices moderate and budgets permit, employers can consider gradually expanding eligibility.
- Apply step therapy where appropriate: Thoughtful step therapy helps control spend while still offering effective options, including lower‑cost generic weight‑loss medications when clinically appropriate and under physician supervision, ideally with access to obesity‑medicine specialists for complex cases.
- Coordinate with PBMs and assess TrumpRx implications: Reevaluate PBM contracts, rebate structures, and formularies to clarify how TrumpRx level pricing and pharmaceutical direct options impact with your actual net costs and ensure employees understand how cash pay options interact with deductibles and out-of-pocket maximums.
- Build a strong social support and culture component: Social support can significantly improve engagement, resilience, and long-term success in weight management programs. Employers work environment, policies, resources and benefits can all influence their employees to take better care of themselves.
With a thoughtful design, GLP-1s can be part of a broader, high value health strategy that improves lives, supports productivity, and uses every healthcare dollar more wisely.

Creating a Data-Informed Strategy to Supporting Your Cancer Care Continuum
Creating a Data-Informed Strategy to Supporting Your Cancer Care Continuum
This article, written by Dr. Ray Fabius, is designed for employers, benefit leaders, and their vendor partners who want to use data to improve cancer prevention, detection, treatment, and survivorship across their covered populations. It is adapted from the Greater Philadelphia Business Coalition on Health’s Oncology Resource Guide and summarizes the section authored by Dr. Fabius, “Creating a Data-Informed Strategy to Support Across the Cancer Care Continuum.”
Why cancer care requires a data-informed employer strategy
Employers today have more information than ever to support a healthy, motivated, and productive workforce, including across the cancer care continuum. Applying population health principles helps organizations reduce health risks, ensure rapid access to care, and support employees and family members facing serious illness. When people are thriving, they are less likely to develop cancer, and if they do, they are better able to tolerate treatment and recover.
With the right knowledge and tools, employers can better understand and track key cancer risk factors. Obesity, certain infections such as hepatitis and human papillomavirus (HPV), and chronic conditions like autoimmune disorders and emphysema all play a role. Using data to identify people with these risks and connect them to appropriate screening procedures and care can help reduce complications and improve outcomes over time.
Building on Prevention Science
A strong cancer care strategy is grounded in the four levels of prevention: primordial, primary, secondary, and tertiary. Primordial prevention focuses on improving the work environment and culture, including reducing occupational exposures such as chemicals and radiation. These efforts are within the domain of environmental health and safety experts as well as occupational health physicians and inform decision-making.
Primary prevention aims to eliminate illness by promoting healthy lifestyles, physical activity, smoking cessation, and vaccination rates for viruses such as HPV and hepatitis B. Secondary prevention emphasizes early detection through cancer screening, such as mammography, which can save lives and sometimes avoid more aggressive treatment (lumpectomy). Tertiary prevention ensures access to the best care, including centers of excellence, and provides ongoing support for the growing population of cancer survivors.
Applying the Triple Aim to Cancer Care
The framework of the Triple Aim—improving care, reducing costs, and enhancing experience—offers a clear structure for a cancer continuum dashboard. Employers can track metrics that demonstrate better outcomes, lower per-case costs, and higher satisfaction with cancer care and benefits.
Across the cancer care continuum, distinct phases such as diagnosis, treatment, survivorship, and palliation each deserve tailored metrics. Measuring efforts in awareness, advocacy, navigation, education, coaching, and case management creates a more complete view of how employers, health plans, vendors, point solutions, and EAPs are performing together.
Step 1: Understand Your Cancer Burden
Begin by building a dashboard that illuminates cancer prevalence across your covered lives. Key element examples include:
- Prevalence of cancer-related health risks such as obesity and smoking.
- Acute illnesses associated with cancer, including infections that require strong primary care follow-up.
- Chronic conditions linked to cancer and the extent to which affected individuals access appropriate specialty care.
- Cancer prevalence by diagnostic groupings and across high-cost claimants.
- Cancer prevalence and types among disability and life insurance claims.
This foundation helps employers prioritize where to focus prevention, early detection, and care management efforts.
Step 2: Define Triple Aim Metrics
Next, frame your Cancer Care Continuum Dashboard around effectiveness, efficiency, and experience.
Effectiveness
Example metrics include:
- Reductions in associated health risks
- Improved cancer screening rates
- Higher percentages of early-stage diagnoses
- Increasing cure rates.
- Greater use of EAP services in families coping with cancer and appropriate use of home care and hospice
Efficiency
Example metrics include:
- Reduction in cancer prevalence
- Reduced cost per case
- Decreased cancer-related Hospital days
- Decreased workdays lost
- Decreased disability days due to cancer
- Increased accommodation for cancer patients
- Faster return-to-work timelines
- Fewer lives lost to cancer
Experience
Example metrics, often survey-based, include:
- Greater awareness of the connection of health risks to Cancer
- Greater awareness of the importance of cancer screening
- Greater satisfaction with the cancer care received
Step 3: Activate and Communicate
Capturing data is only the start; leading employers use multiple communication channels to supplement care delivery and educate/activate their workforce. They prioritize cancers that affect large segments of covered lives, for example, focusing programming on breast cancer when data shows it is highly prevalent.
Best practice includes:
- Ongoing review of benefit design and vendor relationships to ensure they collectively support high-quality cancer care
- Convening a vendor summit to align stakeholders on shared metrics can foster collaboration and accelerate improvement
- Guiding timely referrals to complex case management is particularly valuable for employees who lack medical expertise in their families
Step 4: Support Work, Life, and Recovery
A comprehensive cancer care continuum must also address work and life beyond the clinical setting. Employers can track accommodations that allow employees to keep working during treatment or return to work more quickly, recognizing that continued employment may be associated with better outcomes. Monitoring the use of EAP and related support for both patients and family members offers insight into the broader impact of cancer on the household.
These efforts help employees and their families maintain stability and productivity while navigating a cancer diagnosis. Over time, such support improves not only health but also engagement and retention.
Looking Ahead: Evolving the Dashboard
Cancer diagnostics and treatment are advancing rapidly, with new screening tools, surgical techniques, chemotherapies, radiation approaches, and immunotherapies emerging. As these innovations mature, employer cancer dashboards can expand to incorporate new metrics that reflect earlier detection, more targeted treatment, and better long-term outcomes.
Cancer care is increasingly transforming from a purely catastrophic event into a chronic condition managed with maintenance therapy and vigilant follow-up. By continually refining data strategies, employers can increase the likelihood that workers and their families experience cures, sustained health, and a full return to life at work, at home, and at play.
From Health and Wellbeing Insights to Business Outcomes: Turning Employee Health Data into Workforce Strategy
From Health and Wellbeing Insights to Business Outcomes: Turning Employee Health Data into Workforce Strategy
This article explains how employers can use health and wellbeing data to improve workforce performance and business results. Written by the team at HealthNEXT, led by President and Chief Medical Officer Dr. Ray Fabius, it is designed for C suite executives, CHROs, and CFOs who are accountable for workforce strategy and financial performance. It focuses on employer health and wellbeing analytics, including concepts such as the population health continuum, illness burden, and integrated dashboards that link clinical, productivity, and experience outcomes.
Why your organization’s health data isn’t telling a story yet
Most employers are swimming in data from health plans, PBMs, disability carriers, EAPs, and wellness vendors, yet still struggle to answer a basic question: “What does this say about the health of our workforce and our business?” Data feeds often arrive as fragmented cost reports, emphasize lagging indicators, and underplay the sizeable productivity loss associated with poor health — which research suggests is two to three times direct medical spend. As a result, C-suite leaders see line-item costs, not an integrated view of illness burden, risk, and its impact on performance.
A population health continuum view changes this narrative by tracking your people from those who are well to whose at risk, through their bouts of acute illness, to the diagnosis of their chronic disease, and catastrophic illness. When you connect this continuum to business metrics—absenteeism (health-related days lost), presenteeism, disability, safety incidents, and turnover—you can frame health as a performance lever instead of a benefits expense.
Grouping vs. splitting: Framing health prevalence for the C-suite
Most standard reports split data into narrow diagnostic categories that fail to communicate the true magnitude of an enterprise’s challenge. For example, you might see separate prevalence figures for depression, anxiety, attention deficit disorder, substance abuse and alcohol problems; each line looks small on its own and is easy for leadership to dismiss. For most employers grouping the prevalence of these separate conditions demonstrates the remarkable potential influence behavioral health can have on productivity. For many employers this is the number one health related concern for work performance on a population scale.
A grouping approach aggregates related conditions into strategic diagnostic categories that can best direct health and wellbeing efforts to be most impactful. Instead of five separate mental health conditions independently evaluated, you group them and show that one in four employees has a significant behavioral health issue.
- Instead of treating obesity, hypertension, and high cholesterol as isolated findings, you group them as cardiometabolic risk and connect them to cardiovascular claims, disability, and deaths.
- Instead of listing rare catastrophic conditions by name, you group them as “high-cost claimants” and link them back to upstream risk factors and care gaps.
For example, when Dr. Fabius presented a grouped mental health view to one CEO—demonstrating that one out of every four employees had a behavioral health condition—it fundamentally changed the executive’s understanding of the issue and action plan. Grouping shifts the conversation from “we have some depression and anxiety” to “a quarter of our workforce is struggling.”
Waterfall reporting: Following impact from eligibility to outcome
Another reason health and wellbeing investments underperform on paper is that many vendors report only final outcomes or participation rates, not where potential impact is lost along the way. For example, a vendor may report on the percentage of program completions, but only accounting for those who participated, not for the total population who may have benefited from the intervention. Waterfall reporting solves this by mapping the entire journey from the total eligible population to those who actually improve.
A robust waterfall for a diabetes management program, for example, would show:
- Total number of diabetics in your population (e.g., 1,440 people)
- Number with valid contact information who can be invited.
- Number contacted
- Number who enroll
- Number who actively participate
- Number who complete the program
- Number who achieve improved clinical or utilization outcomes after completion

With this line of sight, you can separate employer issues from vendor issues.
- If there is a large drop from total eligible to “invitable,” you likely have data quality or contact information problems that HR and IT must fix.
- If many are eligible and invited but few enroll, you have a marketing and communications problem because employees aren’t appreciating the program’s value.
- If enrollment is strong, but completion and outcomes are weak, the program design and vendor execution needs scrutiny.
Waterfalls turn “the program isn’t working” into “here is exactly where we’re losing people and who owns that step,” which is the level of specificity the C-suite needs to make governance and investment decisions. This approach is no different than how businesses control manufacturing production or supply chain management.
Illness Burden PlacementTM: One page that connects risk to business impact
To truly align health and wellbeing strategy with business strategy, you need a one page view of your organization’s illness burden that integrates multiple data sources. Dr. Fabius refers to this as an Illness Burden Placement™: a single page that orders, by prevalence, the key elements that define the health of your workforce.
That page should show, in grouped form:
- Top risk factors (e.g., obesity, physical inactivity, smoking, high blood pressure)
- Top reasons why the covered lives are accessing care (grouped by major clinical domains, such as musculoskeletal, cardiometabolic, and behavioral health)
- Top reasons why the covered lives are taking medication (such as behavioral health, or cardiovascular)
- Most prevalent chronic conditions
- Most common drivers of high-cost claimants
- Leading causes of disability both short term and long term
- Leading causes of death (derived from life insurance claims)
When you line these up, patterns emerge. For instance, if cardiometabolic risk factors are prevalent, cardiovascular conditions dominate claims and pharmacy, drive disability and high-cost claimants, and are the leading cause of death, you now have a clear, evidence-based rationale to invest in cardiometabolic prevention and care.

From metrics to a corporate health cockpit
The end goal is not a bigger report—it is a cockpit: an integrated collection of key metrics that lets leaders manage workforce health as a strategic asset. A mature cockpit aligns with healthcare quality’s Triple Aim: improving population health, controlling cost and productivity loss, and elevating employee experience and satisfaction.
Effective C-suite ready metrics and visuals share several traits:
- Quantitative with clear numeric values rather than vague ratings
- Actionable, linked to specific levers in benefits, workplace design, and management practices
- Leading where possible (e.g., risk factor prevalence, primary care attachment) rather than purely lagging (e.g., last year’s spend)
- Causally connected, showing how risk leads to disease, claims, productivity loss, and turnover
Visualization matters. Simple, executive friendly tools, such as red/yellow/green streetlights, gauges against targets, and trend arrows help leaders quickly see where they are on track and where intervention is urgent. Site and business unit level scorecards and dashboards can be rolled up into an enterprise level cockpit, creating constructive competition among locations and shining a light on leaders who have built superior cultures of health and safety.

Ultimately, integrated health and wellbeing data should enable you to demonstrate that a healthier workforce is not just “nice to have,” but a persistent source of productivity, resilience, and financial outperformance. When your data is grouped strategically, tracked through waterfalls, and organized into an Illness Burden Placemat™ and health and wellbeing cockpit, the health of your people becomes legible and investable for the C-suite. Effective health informatics converts employee health from “a cost to control” to an investment. Research by HealthNEXT and others have demonstrated that a healthy workforce is a competitive advantage.
Related Resources: NEXTpert Take: Data-driven Population Health Strategies
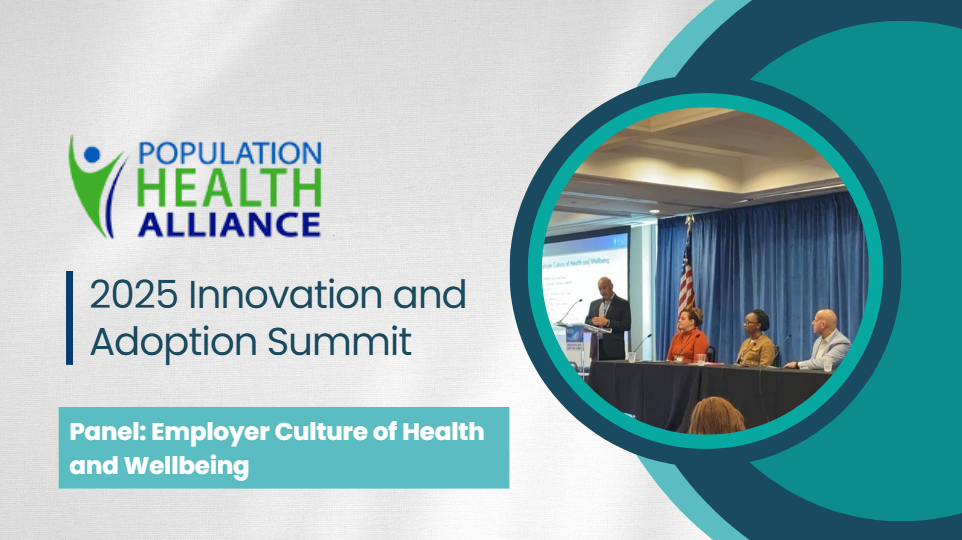
PHA 2025 Innovation and Adoption Summit Panel
PHA 2025 Innovation and Adoption Summit | Panel: Employer Culture of Health and Wellbeing
Speaker: Ivor Kiwi
The Population Health Alliance 2025 Innovation and Adoption Summit featured a panel moderated by Ivor Kiwi, Vice President of Operations at HealthNEXT, bringing together leaders from Hydro-Gear, Netflix, and Aramark to share practical strategies for advancing workplace cultures of health and wellbeing. The discussion underscored a shared mission to improve population health—recognizing that employers have a powerful opportunity to enhance the wellbeing of a large portion of the population through intentional leadership, meaningful benefits, and holistic strategies.
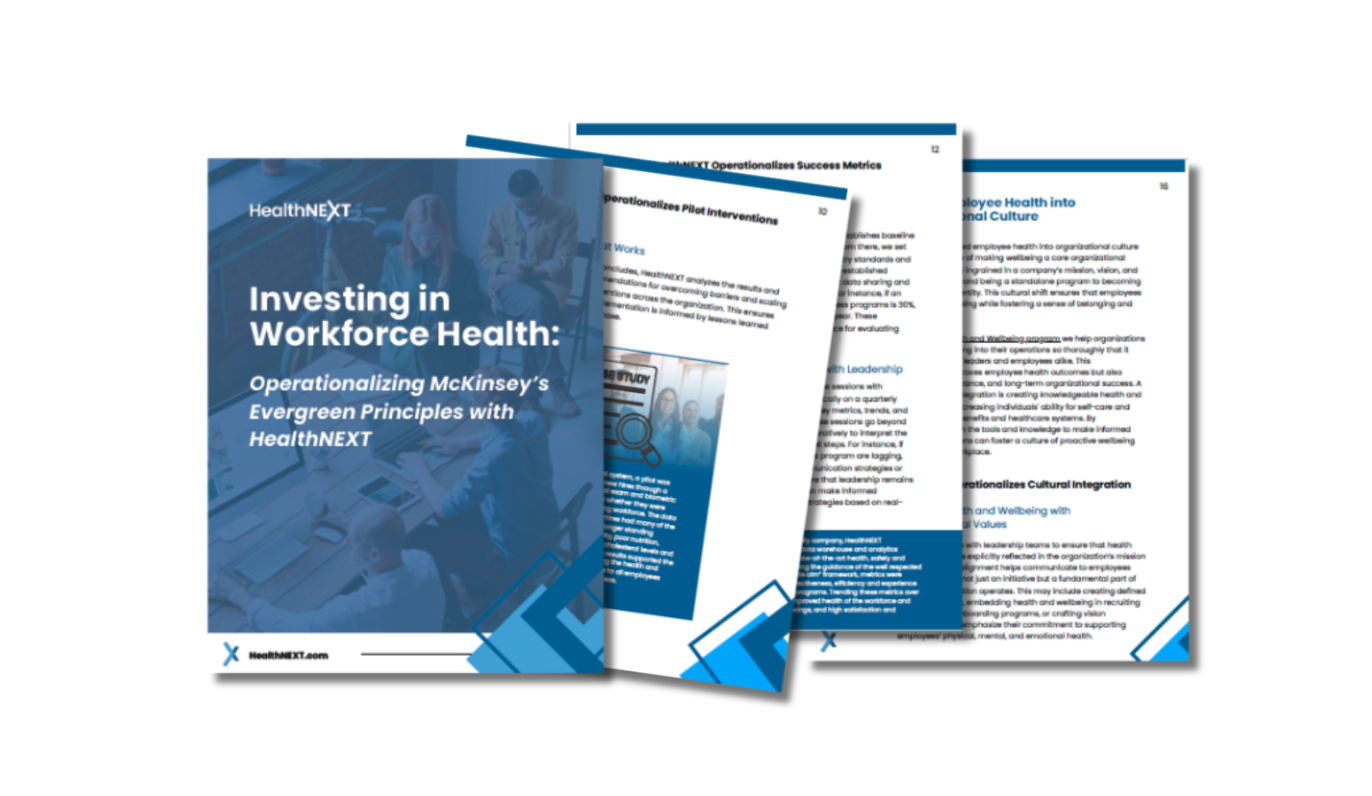
Operationalizing McKinsey’s 6 Evergreen Principles with HealthNEXT
Operationalizing McKinsey’s 6 Evergreen Principles with HealthNEXT
NEXTpert: HealthNEXT Leadership Team
The McKinsey Health Institute’s recent report, Thriving Workplaces: How Employers Can Improve Productivity and Change Lives, highlights the immense value of investing in employee health and wellbeing. Research shows that prioritizing employee wellbeing is both a business and cultural imperative, unlocking up to $11.7 trillion in global economic value and delivering proven returns through higher productivity, reduced absenteeism, lower healthcare costs, and improved retention.
HealthNEXT brings these insights to life by operationalizing McKinsey’s six evergreen principles through a proven, evidence-based framework that embeds wellbeing into the core of organizational culture and strategy. HealthNEXT’s approach empowers organizations to move beyond one-off wellness programs to create sustainable, high-impact cultures of health and wellbeing that deliver measurable business results.
Download the full HealthNEXT report PDF with case study examples.
McKinsey’s 6 Evergreen Principles—and How HealthNEXT Brings Them to Life
- Understand the Baseline Health Status of Employees and the Value at Stake
HealthNEXT conducts comprehensive assessments using advanced analytics and data from multiple sources to identify key health risks, cost drivers, and improvement opportunities. This creates a tailored roadmap for action.
- Develop Initiatives for a Sustainable Healthy Workforce
Initiatives are designed for long-term impact, addressing the full spectrum of employee health needs—from prevention to chronic condition management—while remaining adaptable as workforce needs evolve. By embedding these programs into organizational culture and strategy, employers can help ensure ongoing relevance and effectiveness as their workforce and business environment change.
- Pilot Interventions to Test and Learn
HealthNEXT helps organizations launch targeted pilot programs, gather real-world insights, and refine strategies before scaling successful initiatives across the enterprise. By testing new initiatives on a smaller scale, organizations can gather real-world insights, identify what works, and refine strategies before expanding successful programs more broadly.
- Track Three to Five Metrics to Measure Success
By aligning key performance indicators with business goals and conducting regular data reviews, HealthNEXT ensures organizations can clearly measure progress and make data-driven decisions.
- Ensure Leadership Commitment and Sponsorship
HealthNEXT engages leadership at every step, fostering visible commitment and aligning wellbeing initiatives with organizational priorities to drive participation and accountability.
- Embed Employee Health into Organizational Culture
Wellbeing becomes part of the organization’s DNA, with health-focused values, policies, and peer champions driving engagement and lasting change at every level. This deep integration results in higher employee engagement, improved retention, and stronger performance, as employees feel supported, valued, and motivated to contribute their best.
Key Takeaway:
HealthNEXT transforms McKinsey’s strategic vision into actionable steps that deliver real, sustainable results. By operationalizing these evergreen principles, employers can create thriving workplaces and achieve measurable improvements in workforce health and performance. To get started, contact HealthNEXT today.


NEXTpert Highlight: Emotional WellBeing Assessment (EW55)
NEXTpert Highlight: Emotional WellBeing Assessment (EW55)
NEXTpert: Dan Conti, PhD
Dan Conti, HealthNEXT NEXTpert, and subject matter expert on HealthNEXT’s Emotional WellBeing Assessment, provides insights on the benefits of the EW55 assessment for organizations, HealthNEXT’s approach to emotional wellbeing, and the data and insights the assessment provides to employers.