


Creating a Data-Informed Strategy to Supporting Your Cancer Care Continuum
Creating a Data-Informed Strategy to Supporting Your Cancer Care Continuum
This article, written by Dr. Ray Fabius, is designed for employers, benefit leaders, and their vendor partners who want to use data to improve cancer prevention, detection, treatment, and survivorship across their covered populations. It is adapted from the Greater Philadelphia Business Coalition on Health’s Oncology Resource Guide and summarizes the section authored by Dr. Fabius, “Creating a Data-Informed Strategy to Support Across the Cancer Care Continuum.”
Why cancer care requires a data-informed employer strategy
Employers today have more information than ever to support a healthy, motivated, and productive workforce, including across the cancer care continuum. Applying population health principles helps organizations reduce health risks, ensure rapid access to care, and support employees and family members facing serious illness. When people are thriving, they are less likely to develop cancer, and if they do, they are better able to tolerate treatment and recover.
With the right knowledge and tools, employers can better understand and track key cancer risk factors. Obesity, certain infections such as hepatitis and human papillomavirus (HPV), and chronic conditions like autoimmune disorders and emphysema all play a role. Using data to identify people with these risks and connect them to appropriate screening procedures and care can help reduce complications and improve outcomes over time.
Building on Prevention Science
A strong cancer care strategy is grounded in the four levels of prevention: primordial, primary, secondary, and tertiary. Primordial prevention focuses on improving the work environment and culture, including reducing occupational exposures such as chemicals and radiation. These efforts are within the domain of environmental health and safety experts as well as occupational health physicians and inform decision-making.
Primary prevention aims to eliminate illness by promoting healthy lifestyles, physical activity, smoking cessation, and vaccination rates for viruses such as HPV and hepatitis B. Secondary prevention emphasizes early detection through cancer screening, such as mammography, which can save lives and sometimes avoid more aggressive treatment (lumpectomy). Tertiary prevention ensures access to the best care, including centers of excellence, and provides ongoing support for the growing population of cancer survivors.
Applying the Triple Aim to Cancer Care
The framework of the Triple Aim—improving care, reducing costs, and enhancing experience—offers a clear structure for a cancer continuum dashboard. Employers can track metrics that demonstrate better outcomes, lower per-case costs, and higher satisfaction with cancer care and benefits.
Across the cancer care continuum, distinct phases such as diagnosis, treatment, survivorship, and palliation each deserve tailored metrics. Measuring efforts in awareness, advocacy, navigation, education, coaching, and case management creates a more complete view of how employers, health plans, vendors, point solutions, and EAPs are performing together.
Step 1: Understand Your Cancer Burden
Begin by building a dashboard that illuminates cancer prevalence across your covered lives. Key element examples include:
- Prevalence of cancer-related health risks such as obesity and smoking.
- Acute illnesses associated with cancer, including infections that require strong primary care follow-up.
- Chronic conditions linked to cancer and the extent to which affected individuals access appropriate specialty care.
- Cancer prevalence by diagnostic groupings and across high-cost claimants.
- Cancer prevalence and types among disability and life insurance claims.
This foundation helps employers prioritize where to focus prevention, early detection, and care management efforts.
Step 2: Define Triple Aim Metrics
Next, frame your Cancer Care Continuum Dashboard around effectiveness, efficiency, and experience.
Effectiveness
Example metrics include:
- Reductions in associated health risks
- Improved cancer screening rates
- Higher percentages of early-stage diagnoses
- Increasing cure rates.
- Greater use of EAP services in families coping with cancer and appropriate use of home care and hospice
Efficiency
Example metrics include:
- Reduction in cancer prevalence
- Reduced cost per case
- Decreased cancer-related Hospital days
- Decreased workdays lost
- Decreased disability days due to cancer
- Increased accommodation for cancer patients
- Faster return-to-work timelines
- Fewer lives lost to cancer
Experience
Example metrics, often survey-based, include:
- Greater awareness of the connection of health risks to Cancer
- Greater awareness of the importance of cancer screening
- Greater satisfaction with the cancer care received
Step 3: Activate and Communicate
Capturing data is only the start; leading employers use multiple communication channels to supplement care delivery and educate/activate their workforce. They prioritize cancers that affect large segments of covered lives, for example, focusing programming on breast cancer when data shows it is highly prevalent.
Best practice includes:
- Ongoing review of benefit design and vendor relationships to ensure they collectively support high-quality cancer care
- Convening a vendor summit to align stakeholders on shared metrics can foster collaboration and accelerate improvement
- Guiding timely referrals to complex case management is particularly valuable for employees who lack medical expertise in their families
Step 4: Support Work, Life, and Recovery
A comprehensive cancer care continuum must also address work and life beyond the clinical setting. Employers can track accommodations that allow employees to keep working during treatment or return to work more quickly, recognizing that continued employment may be associated with better outcomes. Monitoring the use of EAP and related support for both patients and family members offers insight into the broader impact of cancer on the household.
These efforts help employees and their families maintain stability and productivity while navigating a cancer diagnosis. Over time, such support improves not only health but also engagement and retention.
Looking Ahead: Evolving the Dashboard
Cancer diagnostics and treatment are advancing rapidly, with new screening tools, surgical techniques, chemotherapies, radiation approaches, and immunotherapies emerging. As these innovations mature, employer cancer dashboards can expand to incorporate new metrics that reflect earlier detection, more targeted treatment, and better long-term outcomes.
Cancer care is increasingly transforming from a purely catastrophic event into a chronic condition managed with maintenance therapy and vigilant follow-up. By continually refining data strategies, employers can increase the likelihood that workers and their families experience cures, sustained health, and a full return to life at work, at home, and at play.
From Health and Wellbeing Insights to Business Outcomes: Turning Employee Health Data into Workforce Strategy
From Health and Wellbeing Insights to Business Outcomes: Turning Employee Health Data into Workforce Strategy
This article explains how employers can use health and wellbeing data to improve workforce performance and business results. Written by the team at HealthNEXT, led by President and Chief Medical Officer Dr. Ray Fabius, it is designed for C suite executives, CHROs, and CFOs who are accountable for workforce strategy and financial performance. It focuses on employer health and wellbeing analytics, including concepts such as the population health continuum, illness burden, and integrated dashboards that link clinical, productivity, and experience outcomes.
Why your organization’s health data isn’t telling a story yet
Most employers are swimming in data from health plans, PBMs, disability carriers, EAPs, and wellness vendors, yet still struggle to answer a basic question: “What does this say about the health of our workforce and our business?” Data feeds often arrive as fragmented cost reports, emphasize lagging indicators, and underplay the sizeable productivity loss associated with poor health — which research suggests is two to three times direct medical spend. As a result, C-suite leaders see line-item costs, not an integrated view of illness burden, risk, and its impact on performance.
A population health continuum view changes this narrative by tracking your people from those who are well to whose at risk, through their bouts of acute illness, to the diagnosis of their chronic disease, and catastrophic illness. When you connect this continuum to business metrics—absenteeism (health-related days lost), presenteeism, disability, safety incidents, and turnover—you can frame health as a performance lever instead of a benefits expense.
Grouping vs. splitting: Framing health prevalence for the C-suite
Most standard reports split data into narrow diagnostic categories that fail to communicate the true magnitude of an enterprise’s challenge. For example, you might see separate prevalence figures for depression, anxiety, attention deficit disorder, substance abuse and alcohol problems; each line looks small on its own and is easy for leadership to dismiss. For most employers grouping the prevalence of these separate conditions demonstrates the remarkable potential influence behavioral health can have on productivity. For many employers this is the number one health related concern for work performance on a population scale.
A grouping approach aggregates related conditions into strategic diagnostic categories that can best direct health and wellbeing efforts to be most impactful. Instead of five separate mental health conditions independently evaluated, you group them and show that one in four employees has a significant behavioral health issue.
- Instead of treating obesity, hypertension, and high cholesterol as isolated findings, you group them as cardiometabolic risk and connect them to cardiovascular claims, disability, and deaths.
- Instead of listing rare catastrophic conditions by name, you group them as “high-cost claimants” and link them back to upstream risk factors and care gaps.
For example, when Dr. Fabius presented a grouped mental health view to one CEO—demonstrating that one out of every four employees had a behavioral health condition—it fundamentally changed the executive’s understanding of the issue and action plan. Grouping shifts the conversation from “we have some depression and anxiety” to “a quarter of our workforce is struggling.”
Waterfall reporting: Following impact from eligibility to outcome
Another reason health and wellbeing investments underperform on paper is that many vendors report only final outcomes or participation rates, not where potential impact is lost along the way. For example, a vendor may report on the percentage of program completions, but only accounting for those who participated, not for the total population who may have benefited from the intervention. Waterfall reporting solves this by mapping the entire journey from the total eligible population to those who actually improve.
A robust waterfall for a diabetes management program, for example, would show:
- Total number of diabetics in your population (e.g., 1,440 people)
- Number with valid contact information who can be invited.
- Number contacted
- Number who enroll
- Number who actively participate
- Number who complete the program
- Number who achieve improved clinical or utilization outcomes after completion

With this line of sight, you can separate employer issues from vendor issues.
- If there is a large drop from total eligible to “invitable,” you likely have data quality or contact information problems that HR and IT must fix.
- If many are eligible and invited but few enroll, you have a marketing and communications problem because employees aren’t appreciating the program’s value.
- If enrollment is strong, but completion and outcomes are weak, the program design and vendor execution needs scrutiny.
Waterfalls turn “the program isn’t working” into “here is exactly where we’re losing people and who owns that step,” which is the level of specificity the C-suite needs to make governance and investment decisions. This approach is no different than how businesses control manufacturing production or supply chain management.
Illness Burden PlacementTM: One page that connects risk to business impact
To truly align health and wellbeing strategy with business strategy, you need a one page view of your organization’s illness burden that integrates multiple data sources. Dr. Fabius refers to this as an Illness Burden Placement™: a single page that orders, by prevalence, the key elements that define the health of your workforce.
That page should show, in grouped form:
- Top risk factors (e.g., obesity, physical inactivity, smoking, high blood pressure)
- Top reasons why the covered lives are accessing care (grouped by major clinical domains, such as musculoskeletal, cardiometabolic, and behavioral health)
- Top reasons why the covered lives are taking medication (such as behavioral health, or cardiovascular)
- Most prevalent chronic conditions
- Most common drivers of high-cost claimants
- Leading causes of disability both short term and long term
- Leading causes of death (derived from life insurance claims)
When you line these up, patterns emerge. For instance, if cardiometabolic risk factors are prevalent, cardiovascular conditions dominate claims and pharmacy, drive disability and high-cost claimants, and are the leading cause of death, you now have a clear, evidence-based rationale to invest in cardiometabolic prevention and care.

From metrics to a corporate health cockpit
The end goal is not a bigger report—it is a cockpit: an integrated collection of key metrics that lets leaders manage workforce health as a strategic asset. A mature cockpit aligns with healthcare quality’s Triple Aim: improving population health, controlling cost and productivity loss, and elevating employee experience and satisfaction.
Effective C-suite ready metrics and visuals share several traits:
- Quantitative with clear numeric values rather than vague ratings
- Actionable, linked to specific levers in benefits, workplace design, and management practices
- Leading where possible (e.g., risk factor prevalence, primary care attachment) rather than purely lagging (e.g., last year’s spend)
- Causally connected, showing how risk leads to disease, claims, productivity loss, and turnover
Visualization matters. Simple, executive friendly tools, such as red/yellow/green streetlights, gauges against targets, and trend arrows help leaders quickly see where they are on track and where intervention is urgent. Site and business unit level scorecards and dashboards can be rolled up into an enterprise level cockpit, creating constructive competition among locations and shining a light on leaders who have built superior cultures of health and safety.

Ultimately, integrated health and wellbeing data should enable you to demonstrate that a healthier workforce is not just “nice to have,” but a persistent source of productivity, resilience, and financial outperformance. When your data is grouped strategically, tracked through waterfalls, and organized into an Illness Burden Placemat™ and health and wellbeing cockpit, the health of your people becomes legible and investable for the C-suite. Effective health informatics converts employee health from “a cost to control” to an investment. Research by HealthNEXT and others have demonstrated that a healthy workforce is a competitive advantage.
Related Resources: NEXTpert Take: Data-driven Population Health Strategies

Building A Culture of Health to Flatten Healthcare Costs
Building A Culture of Health to Flatten Healthcare Costs
Publication: CLEARly Beneficial Podcast
HealthNEXT President and Chief Medical Officer Dr. Ray Fabius joined the CLEARly Beneficial podcast to discuss why building a strong culture of health, safety, and wellbeing is more powerful than price negotiations when it comes to flattening healthcare cost trends. He explains how mid‑market employers can leverage population health expertise, leadership alignment, and HealthNEXT’s evidence‑based assessment and roadmap to turn healthcare into a strategic advantage rather than a strain on the bottom line.
Why GLP-1 Coverage Alone Isn't Enough
Why GLP-1 Coverage Alone Isn't Enough
Publication: Employee Benefit News
HealthNEXT President and CEO Ray Fabius, M.D., shares in Employee Benefit News why simply adding GLP-1 medications to your benefits package is not enough to ensure sustainable results for weight management and health improvement.
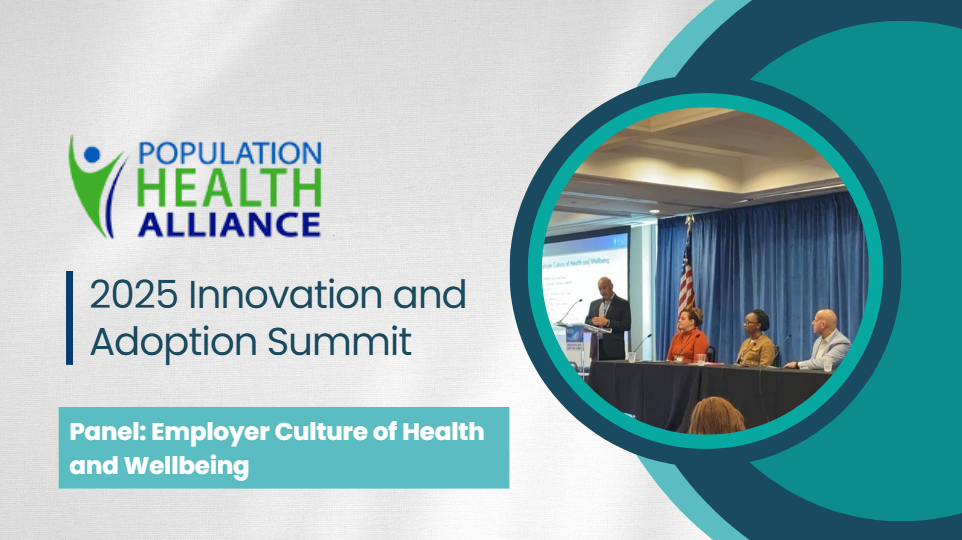
PHA 2025 Innovation and Adoption Summit Panel
PHA 2025 Innovation and Adoption Summit | Panel: Employer Culture of Health and Wellbeing
Speaker: Ivor Kiwi
The Population Health Alliance 2025 Innovation and Adoption Summit featured a panel moderated by Ivor Kiwi, Vice President of Operations at HealthNEXT, bringing together leaders from Hydro-Gear, Netflix, and Aramark to share practical strategies for advancing workplace cultures of health and wellbeing. The discussion underscored a shared mission to improve population health—recognizing that employers have a powerful opportunity to enhance the wellbeing of a large portion of the population through intentional leadership, meaningful benefits, and holistic strategies.
HealthNEXT Recognized as Finalist for TLC Lions Human Company of the Year
HealthNEXT Recognized as Finalist for TLC Lions Human Company of the Year
Publication: TLC Lions Human Award
HealthNEXT is proud to announce its recent recognition as a finalist for the TLC Lions Human Company of the Year award. This prestigious honor celebrates organizations that go above and beyond to create truly human-centric workplace cultures, prioritizing empathy, wellbeing, and people-first values at every level of the organization.
What the Nomination Means
Being named a finalist in this category is a testament to HealthNEXT’s unwavering commitment to building a workplace culture of health and wellbeing where employees are not just valued but empowered. The TLC Lions Human Company of the Year award is given to organizations that:
- Demonstrate an exceptional commitment to cultivating a human workplace culture.
- Prioritize people through company-wide policies, day-to-day practices, and leadership at every level.
- Serve as leading examples of employers that are the best to work for and with.
Being named a finalist for the TLC Lions Human Company of the Year award underscores HealthNEXT’s values and mission: to put people at the heart of every decision and process. This recognition affirms the company’s belief that the most successful organizations are those that support, nurture, and celebrate their people.
“We are honored to be recognized as a finalist for this award. At HealthNEXT, our team is passionate about making a real difference in the health and wellbeing of employees, the organizations they serve, and the surrounding communities. This acknowledgment motivates us to continue leading with empathy and purpose.”
— Thomas Lundquist, CEO, HealthNEXT
As HealthNEXT continues to innovate and lead in health and wellbeing, this recognition serves as both validation and inspiration for the important work ahead.
The TLC Lions Awards
The TLC Lions Awards celebrate organizations and individuals making a difference by championing human-first values. The Human Company of the Year category highlights employers who make people the priority in every department, process, and practice, setting standards for others in the industry.